Monitoring as a Service (MaaS)
Cloud-based data centre monitoring


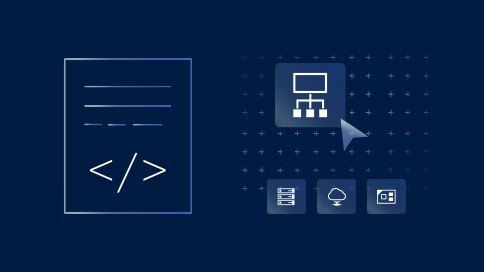
Monitor health metrics via the Data Center Designer
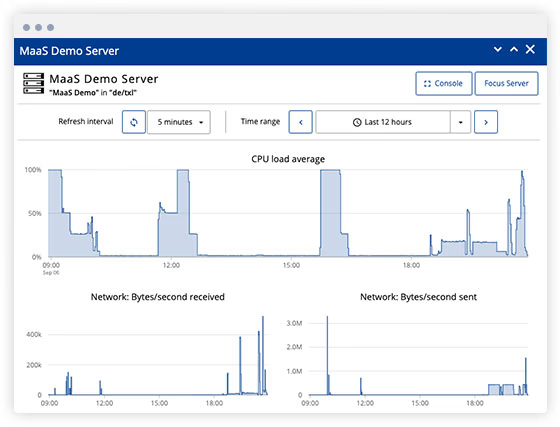
Keep your applications and services running at their peak by making decisions early on the back of sound data. With MaaS, you get a sophisticated yet simple tool for tracking relevant metrics such as CPU load, network throughput, and storage performance in real time. You can use it from the Data Center Designer (DCD) or via API-connected tools like Prometheus.
MaaS is available to you at any time, at no cost, and doesn't require an additional software client. There is no need for complex implementation or configuration – simply set up customisable event notifications to keep an eye on what's most important.
Plan better without any added costs
We built MaaS so that you have quick and intuitive access to settings via the Data Center Designer. Benefit from a ready-to-use monitoring and control system that you can adapt to your needs in just a couple of clicks. Fully customisable alarm settings provide alerts when triggered, notifying you to take action. And via a PromQL-compatible interface, you can export the past 14 days of data and events from your virtual data centre, integrating persistently in your Prometheus system.
You don't need to worry about any details relating to installation, configuration or implementation, because MaaS is fully integrated into IONOS CLOUD. This reduces your day-to-day workload, helps you to better guarantee your required service levels, and frees up your resources.

Comprehensive infrastructure monitoring
Fully integrated in the DCD | Tailor your monitoring to your operational needs via the Data Center Designer (DCD). Using it you can monitor your virtual machines (VM) as well as Cloud Cubes by adjusting a few settings. It's all fully customisable and available 24/7. | |
Customisable alarm settings | Define your own monitoring events and when you get notifications. This way, you can act before load peaks happen, ensuring the availability of your services. | |
Works with any operating system | MaaS serves you with key health metrics regardless of your infrastructure setup, or which OS or distribution your instances boot from; no matter if you boot from the network, from IONOS CLOUD images, from block storage, or your own private images or snapshots. | |
Connects to outside tools | Integrate your MaaS data into external tools, easily linkable via API with Prometheus and others. This gives you a holistic view of the performance of your systems and keeps you one step ahead of any possible scenario at all times. | |
14-day review | Use historical data logs and defined events for a period of up to 14 days in the past to maximise system transparency. You can directly process this data via an interface, use it to optimise your monitoring strategy, and store persistently after the 14-day period. | |
Fully operable without a client | IONOS CLOUD gathers monitoring metrics without installing additional clients on your instances – saving your team added work. Best of all, MaaS is available with newly provisioned virtual servers or cubes, or existing instances. | |
Horizontal VM auto scaling | When combined with MaaS, horizontal VM auto scaling allows you to automatically adapt your cloud infrastructure to your future workloads. If monitoring reveals an increased load over a defined period of time, additional instances can be automatically deployed. This means that workloads can be distributed and processed across even more virtual instances. Your users will always experience a high-performance and responsive application. As soon as the workloads fall below a pre-defined threshold, VM instances can be deleted, optimising your costs. Find more information in our [[https://docs.ionos.com/cloud/network-services/vm-auto-scaling|documentation | documentation]] |
Fully integrated in the DCD | |
|---|---|
Tailor your monitoring to your operational needs via the Data Center Designer (DCD). Using it you can monitor your virtual machines (VM) as well as Cloud Cubes by adjusting a few settings. It's all fully customisable and available 24/7. | |
Customisable alarm settings | |
Define your own monitoring events and when you get notifications. This way, you can act before load peaks happen, ensuring the availability of your services. | |
Works with any operating system | |
MaaS serves you with key health metrics regardless of your infrastructure setup, or which OS or distribution your instances boot from; no matter if you boot from the network, from IONOS CLOUD images, from block storage, or your own private images or snapshots. | |
Connects to outside tools | |
Integrate your MaaS data into external tools, easily linkable via API with Prometheus and others. This gives you a holistic view of the performance of your systems and keeps you one step ahead of any possible scenario at all times. | |
14-day review | |
Use historical data logs and defined events for a period of up to 14 days in the past to maximise system transparency. You can directly process this data via an interface, use it to optimise your monitoring strategy, and store persistently after the 14-day period. | |
Fully operable without a client | |
IONOS CLOUD gathers monitoring metrics without installing additional clients on your instances – saving your team added work. Best of all, MaaS is available with newly provisioned virtual servers or cubes, or existing instances. | |
Horizontal VM auto scaling | |
When combined with MaaS, horizontal VM auto scaling allows you to automatically adapt your cloud infrastructure to your future workloads. If monitoring reveals an increased load over a defined period of time, additional instances can be automatically deployed. This means that workloads can be distributed and processed across even more virtual instances. Your users will always experience a high-performance and responsive application. As soon as the workloads fall below a pre-defined threshold, VM instances can be deleted, optimising your costs. Find more information in our [[https://docs.ionos.com/cloud/network-services/vm-auto-scaling|documentation | |
documentation]] |
MaaS use cases
Use case
Use case
Use case
Use case
Get started now
1
Quick registration
2
Easy setup
3
Ready in minutes
Resources